
We all hear about climate change on the news and other media, although there are clearly different views about what climate change means and what actions should be taken. If nothing else, everyone's personal perception of climate change is likely to be influenced by where they live and what they do. For example, any consistent change in the long-term weather trend would indicate climate change, but would also be superimposed by natural fluctuations in weather. The two phenomena occur to different degrees at different locations on the globe. Secondly, people living in urban or highly managed environments experience human-made change regularly and may experience less natural change in the environment. World statistics indicate that >50% of the world population live in urban areas.
I believe that anyone, and especially those that like me are not experts on climate or meteorology, should have a chance to form and update their views based on scientific information. Fortunately, facts and data are freely available from agencies and organisations worldwide, for example [1-7] - here I summarise some key indicators supported by long-term monitoring.
Steady melting of the global ice mass and the rise in sea level
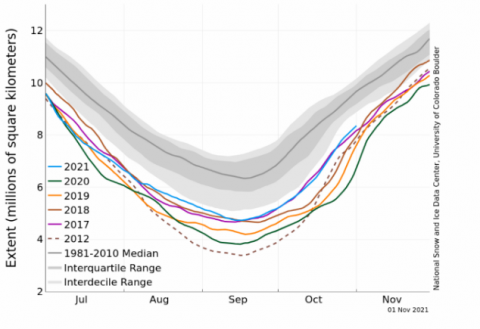
A striking and consistent sign of warming is the reduction in the ice mass across the planet. Melting of ancient ice has occurred in glaciers and ice sheets on land worldwide, showing dramatic changes since the mid-20th century (Figure 1) [2]. On the other hand, sea ice in the Arctic Ocean has been reducing in extent and depth for decades. The process has accelerated since the 2000's (Figure 2) [3], with the ice extent in the years after 2010 being much smaller than that in the previous 30 years. In 2020 the ice extent was one of the lowest on record. According to NASA [1], at the current pace, the Arctic Ocean is expected to become essentially ice free in summer before the middle of the century.
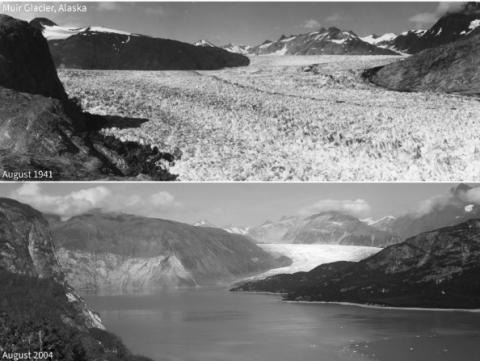
Figure 1. Retreat of Alaska's Muir glacier between August 1941 and August 2004. Source: NOAA.
While ice melting has consequences to wildlife and to people's livelihoods locally, it also has global consequences, such as a rise in sea level, which affects people living in coastal areas worldwide. This rise is driven by the thermal expansion of water as the ocean warms, and by the melting of land ice across the world, including Greenland and the Antarctica. Estimates based on long-term tide gauges and recent satellite data indicate there has been a global average rise of at least 200 mm since 1900, at an increasing pace, which in the last decade was about 3.6mm per year. In 2020, the global average sea level hit a record high of about 91 mm above the 1993-2008 average (Figure 3) [2, 8].
These melting trends are consistent with those in other climate indicators, such as global temperature and global concentration of carbon dioxide in the atmosphere. There is also an increase in extreme and unpredictable weather events such as storms, floods, drought and wildfire, and severe damage to ecosystems that wildlife and agriculture depend on; however, the connection between these events and global warming is less direct and, therefore, more challenging to demonstrate.
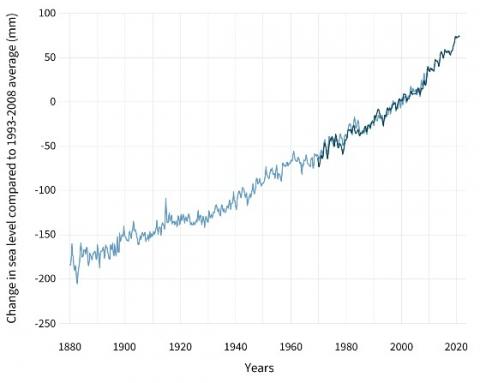
Figure 2 (above). Arctic sea ice extent (area of ocean with at least 15% sea ice). Each curve shows seasonal variation during the year. Curves correspond to years after 2010 and to the median and range during 1980-2010. Source: NSIDC
Figure 3 (below). Global seasonal (3-month) sea level (mm) estimates in relation to the 1993-2008 average, based on a combination of tide gauges (light blue) and satellite data (darker blue). Oscillations are due to seasonal variation. Source. NOAA
Steady increase in land and sea temperature
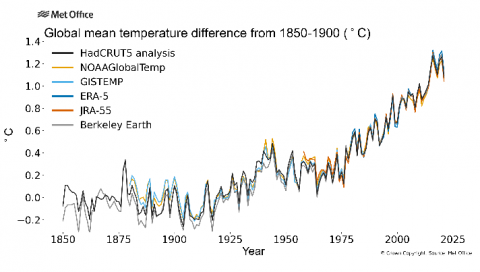
Both sea and land surface temperature have been rising steadily for decades in relation to pre-industrial levels, and are doing so at increasing pace (Figure 4) [4]. According to several meteorological agencies, the world is now over 1°C warmer than it was before widespread industrialisation [1-4, 7]. They report that the 10 warmest years - in a series of 171 years since 1850 - have occurred since 2005. The year of 2016, when temperatures were boosted up by the El Niño weather phenomenon, was the warmest, while 2020 and 2019 were the second and third warmest on record.
Figure 4.Annual global mean temperature expressed as a difference from pre-industrial conditions. There is good agreement between the different data sets shown. Source: Met Office; provides details of how the analysis was produced.
Steady increase in atmospheric CO2 - the cause of global warming
The likely cause of global warming is an increase in the atmospheric concentration of greenhouse gases (GHG), predominantly carbon dioxide (CO2), but also methane and nitrous oxide. This increase amplifies the Earth's natural greenhouse effect, i.e. it reduces its ability to cool down through the release of heat to outer-space. Heat is produced daily by the incoming solar radiation. Atmospheric CO2 is produced by a range of natural phenomena, but in the recent past it has been produced increasingly by human activity, such as the burning of fossil fuels and the unsettling of natural ecosystems that have switched from storing to releasing CO2 and methane.
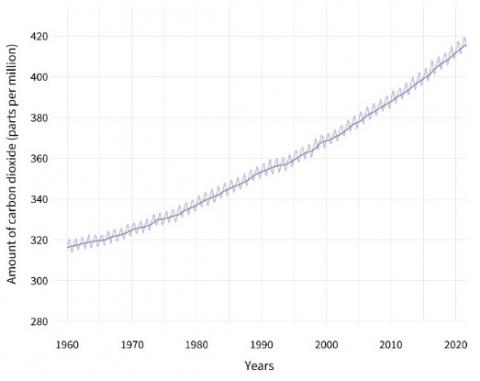
The atmospheric concentrations of GHG have increased significantly since the start of the Industrial Revolution. In the case of CO2, the longest-standing record (at the Mauna Loa Observatory in Hawaii) shows the average concentration raised from 316 parts per million (ppm) in 1959, to more than 412 ppm in 2020 (Figure 5) [2]. Similar rates of increase have been recorded at other stations worldwide. Since pre-industrial times, the atmospheric concentration of GHG has increased by more than 40% for CO2, more than 150% for methane, and about 20% for nitrous oxide [8]. More than half of the increase in CO2 has occurred since 1970.
Figure 5.Monthly average atmospheric CO2 concentration (parts per million, ppm) since 1959 at the Mauna Loa Observatory, Hawaii. The seasonal cycling is driven by summertime growth and winter decay of Northern Hemisphere vegetation. Source: NOAA
In addition to direct atmospheric observation, scientists have estimated the concentration of GHG in the far past by analysing air trapped naturally inside ancient ice. Ice cores from Antarctica show a significant increase in CO2 concentration from the 19th century, having been steady at 260-280 ppm during the previous 10,000 years. Ice core records extending back 800,000 years show variation in CO2 concentration within 170 to 300 ppm throughout sequential "glacial" cycles (Figure 6) [2]. No concentration above 300 ppm is seen in ice core records throughout the last 800,000 years, except since 200 years ago. These cycles appear to be very regular and are thought be driven by a combination of changes in the Earth's orbit and in solar activity. The time scales associated with orbital changes range from tens of thousands to hundreds of thousands of years, and with solar changes range from 11 to thousands of years. Scientists have demonstrated that the sharp exceptional rise in CO2 concentration in the last 200 years is too rapid and too large to be explained by these natural oscillations [1, 2, 7, 8]. Volcanic activity is another natural phenomena contributing to current atmospheric CO2, but the resulting annual emissions are estimated to be much smaller than those from human activity [1].
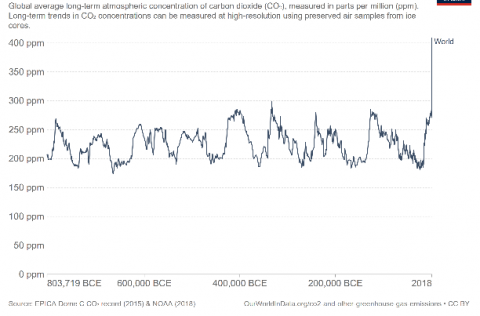
Figure 6. Variation in average concentrations of CO2 in the atmospheric (parts per million, ppm) during the past 800,000 years. There is a sharp rise in atmospheric CO2 from the 19th century. Source: Our World in Data, and NOAA
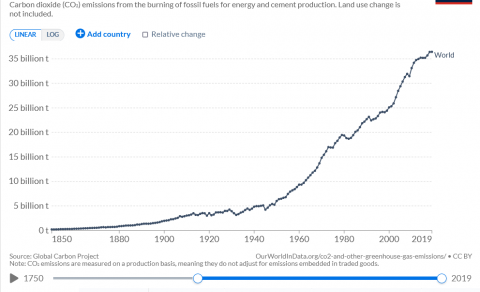
The only process known to have occurred in the last 200 years that can explain these observations is CO2-emiting human activity. The estimated global emissions of CO2 by human activity (Figure 7) [7, 10] show a rising trend that is simultaneous and very similar to the observed rising trend in atmospheric CO2 concentration. Prior to the Industrial Revolution, the global annual emissions of CO2 were very low, and raised relatively slowly to 6 billion tonnes in 1950; they raised nearly four-fold to 22 billion tonnes by 1990, and six-fold to 36 billion tonnes in 2019, i.e. emission nearly doubled every 20 years since 1950. While the pace of increase has slowed down slightly in recent years, annual emissions have not yet reached a peak, i.e. they continue to increase (Figure 7).
Figure 7. Global annual production-based emissions of CO2 (tonnes) from 1850 to 2019. This is based on territorial emissions, which do not account for emissions embedded in traded goods. Source: Our World in Data, and Global Carbon Project
Conclusion
These data demonstrate unquestionably a strong correlation between the increase in CO2-emitting human activity and the increases in atmospheric CO2, as well as in other global climate indicators [5]. However, there is also very strong evidence that human activity is the overwhelming cause of the ongoing climate warming. Firstly, all the increasing trends have occurred consistently and within the last 200 years, which scientists argue excludes alternative explanations based on natural phenomena. Secondly, we have a much well-founded understanding of the mechanisms involved in regulating global climate, along with predictions from mathematical models based on this knowledge that are consistent with human-induced climate change [9].
As we only have this planet to live on, it is not an option to pursue this experiment for even greater scientific certainty without causing further irreparable damage. According to NASA [1], the effects of human-caused global warming happening now are irreversible on the timescale of people alive today, and will worsen in the decades to come. Consequently, we must wait no longer to reduce human-caused emissions to slow down global warming and its consequences. Trusting the understanding and predictions of mathematical models of climate, which like those of everyday weather stand on a wealth of experience and empirical data, offers the best-available guidance on the future impact of our actions. These models are saying that we must change our behaviour in order to restrain future climate and protect the world as we know it. World nation leaders meeting at COP26 must take decisive action now.

References
- [1] National Aeronautics and Space Administration (NASA), https://climate.nasa.gov/ https://climate.nasa.gov/evidence/
- [2] National Oceanic and Atmospheric Administration (NOAA), https://climate.nasa.gov/ , https://www.climate.gov/news-features/understanding-climate/climate-change-glacier-mass-balance , https://www.climate.gov/news-features/understanding-climate/climate-change-global-temperature
- [3] National Snow and Ice Data Center (NSIDC), https://nsidc.org/arcticseaicenews/
- [4] Meteorological Office (MO) , https://www.metoffice.gov.uk/weather/climate
- [5] World Meteorological Organisation (WMO) , https://public.wmo.int/en , https://climatedata-catalogue.wmo.int/climate_indicators
- [6] European Centre for Medium-Range Weather Forecasts (ECMWF) , https://www.ecmwf.int/ , https://climate.copernicus.eu/
- [7] Our World in Data, https://ourworldindata.org/ , https://ourworldindata.org/co2-emissions, https://ourworldindata.org/co2-and-other-greenhouse-gas-emissions
- [8] The Royal Society, https://royalsociety.org/topics-policy/projects/climate-change-evidence-causes/ , https://royalsociety.org/topics-policy/projects/climate-change-evidence-causes/basics-of-climate-change/
- [9] Intergovernmental Panel on Climate Change (IPCC) , https://www.ipcc.ch/report/ar5/wg3/ , https://archive.ipcc.ch/ipccreports/tar/wg1/045.htm
- [10] Global Carbon Budget https://www.globalcarbonproject.org/carbonbudget/index.htm
- [F1] NOAA, https://www.climate.gov/news-features/understanding-climate/climate-change-glacier-mass-balance
- [F2] NSIDC, November 1, 2021, University of Colorado Boulder, USA. https://nsidc.org/arcticseaicenews/
- [F3] NOAA, Climate.gov image based on analysis and data from Philip Thompson, University of Hawaii Sea Level Center. https://www.climate.gov/news-features/understanding-climate/climate-change-global-sea-level
- [F4] Met Office, Nov 2021, https://climate.metoffice.cloud/temperature.html
- [F5] Climate.gov image, based on data from NOAA Global Monitoring Lab and Dr. Pieter Tans, NOAA/GML (gml.noaa.gov/ccgg/trends/) and Dr. Ralph Keeling, Scripps Institution of Oceanography (scrippsco2.ucsd.edu/). https://www.climate.gov/news-features/understanding-climate/climate-change-atmospheric-carbon-dioxide
- [F6] Our World in data https://ourworldindata.org/co2-and-other-greenhouse-gas-emissions, NOAA, and, Bernhard Bereiter, Sarah Eggleston, Jochen Schmitt, Christoph Nehrbass-Ahles, Thomas F. Stocker, Hubertus Fischer, Sepp Kipfstuhl and Jerome Chappellaz. 2015. Revision of the EPICA Dome C CO2 record from 800 to 600 kyr before present. Geophysical Research Letters. . doi: 10.1002/2014GL061957
- [F7] Our World in Data CO2 emissions, and Global Carbon Project Supplemental data of Global Carbon Project 2021 (1.0). Andrew, Robbie M., & Peters, Glen P. (2021). The Global Carbon Project's fossil CO2 emissions dataset. Zenodo. Global Carbon Project.