Finding sparse networks in gene expression data
High-throughput technologies for measuring gene expression, such as microarrays and next-generation sequencing, have enabled scientists to routinely collect expression data for thousands of genes across a range of experimental conditions. For example, whole genome microarrays for the human can measure RNA levels for c. 20,000 genes.
The interactions between these genes can be visualized as a network, where the genes are represented as nodes and the interactions between them as edges. Graphical models are a well-known way to construct such networks from data. They are based on the estimation of a partial correlation matrix (inverse of the correlation matrix) and link the nodes corresponding to two variables if there is sufficient evidence that they explain variation in each other after accounting for other confounding variables.
In order to use this approach in cases where the number of genes greatly exceeds the number of samples, we have to assume that the network is sparse, both for mathematical / computational reasons and in order to obtain an interpretable network. There are various ways to enforce this sparsity, and many of these use a lasso-type penalised regression approach. All such methods depend on a tuning parameter to determine how sparse the estimated network will actually be. BioSS has developed a new method to choose this parameter, applying the minimisation of risk functions calculated using network structure properties such as connectivity or clustering. We have also generalised our method to the situation where two sets of samples (e.g. RNA tumor samples and healthy ones) are analysed simultaneously to estimate both joint and differential networks.
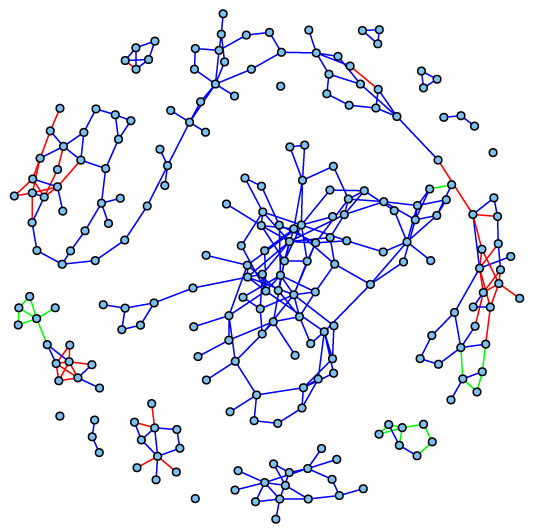
Joint sparse gene expression network estimated from 25 paired tumor / normal human colon samples. Edges indicate interactions between genes, coloured according to whether these interactions are common to both sample types (blue), only present in tumor samples (green), or only present in samples of healthy tissue (red).